In this article I am going to teach you:
- How to know if a trading robot works
- How to detect mediocre trading courses
- Determine who is a good trader
- How to improve your own trading (DIY)
And I’ll explain:
Why I’m not interested in a secret trading strategy that returns a lot of money!
No, there is no error in that statement!
We go by parts. It is not easy for a novice to detect in a sea of mediocre people who pretend to be great traders and determine if they are really going to sell you a trading course that works. How to know if they are good traders? We are going to discard.
First sign: If they tell you how much they earn by trading and even give you supposedly operational results… We can be 100% convinced that we are in front of a clown of trading. An individual who mounts an act of circus in trading to finally make us laugh with his/her ignorance. Maybe some do not laugh now but I promise that everyone will laugh out loud once they finish reading.
Why? Simple. Professional traders know that profits are NOT the main parameter to determine if a trading strategy is good or simply garbage. The most likely is that if they have tried to show how good they are using this “measure” according to them, their trading is useless because they clearly do not know anything about the matter and these really are behind your money.
Let’s explain that better. They have told you nothing when they say they earn so many thousands of dollars if they have not told you how much they have invested. Or in more professional terms how much they have risked. Clearly, the more you risk, the more you should win … or lose. Did they tell you the operations with losses? Probably not. And all … I mean, absolutely all trading strategy have losses. Why? For the simple reason that markets are stochastic systems.
https://en.wikipedia.org/wiki/Stochastic_process
That is, they contain random variables that are unpredictable for absolutely every trader or trading system. Not even the broker knows for sure what is going to happen. And that is why every trading strategy must have a risk control system. If you do not have it, you have a time bomb in your hands for your broker account.
Equivalent to that if they have not told you that they have lost they are simply hiding reality from you. But there is more … a trading system is useless if today you earn 1000 dollars and tomorrow you lose 2000.
We can apply this also for trading robots. For example, if someone is going to buy a car, the first thing to do is to learn about the parameters of the car in order to decide. Let’s see if a car has lots of power, luxury, the king of the road but it does 6 miles per gallon you better buy something else. In trading it happens the same, you have to know what is being bought. When a person tries to sell you a course or a trading robot and shows you how many dollars you earn, they have told you nothing at all. And I repeat NOTHING. It’s like saying “the car reaches 55 miles / h” but he/she has not even told you how long it takes or how much it spends … He/she has only given you a hook hiding a lot of the reality. With trading, it’s the same, just trying to fish your money making you believe that you’re going to become a millionaire overnight. Be careful.
And my trading? Is it good? Is it bad? Is it mediocre? How to do it better?
To know it … first you have to measure it. And yes, trading is measured. If you have not, I regret to inform you that your trading is most probably terrible or at best mediocre. But how do we measure this? We already saw that the profits do not say anything. If we do a spectacular trade with 20 dollars we will earn much less than with a mediocre trading with 10 thousand. Capital does not makes the trader. It is not that the returns do not matter, however, they are not the most important thing. But … how to compare one strategy against another? To compare two numbers is easy, but two trading strategies … That is much more complicated. What if we can take this to numbers and compare these numbers? Let’s see.
Winning today and losing tomorrow in trading is known as Drawdown.
How is the Drawdown calculated?
It is usually given in percent and this is defined as the maximum loss in a trading period of time.
That is, it is calculated with the capital losses. And gentlemen, capital is what a professional trader protects most. This is the gas in your car. A professional trader prefers to lose some capital to get stuck in an operation. It means not having capital available for the numerous opportunities that the market can offer. Of course, the lower this Drawdown the better the trading strategy will be. Generally less than 15% starts to be a good value.
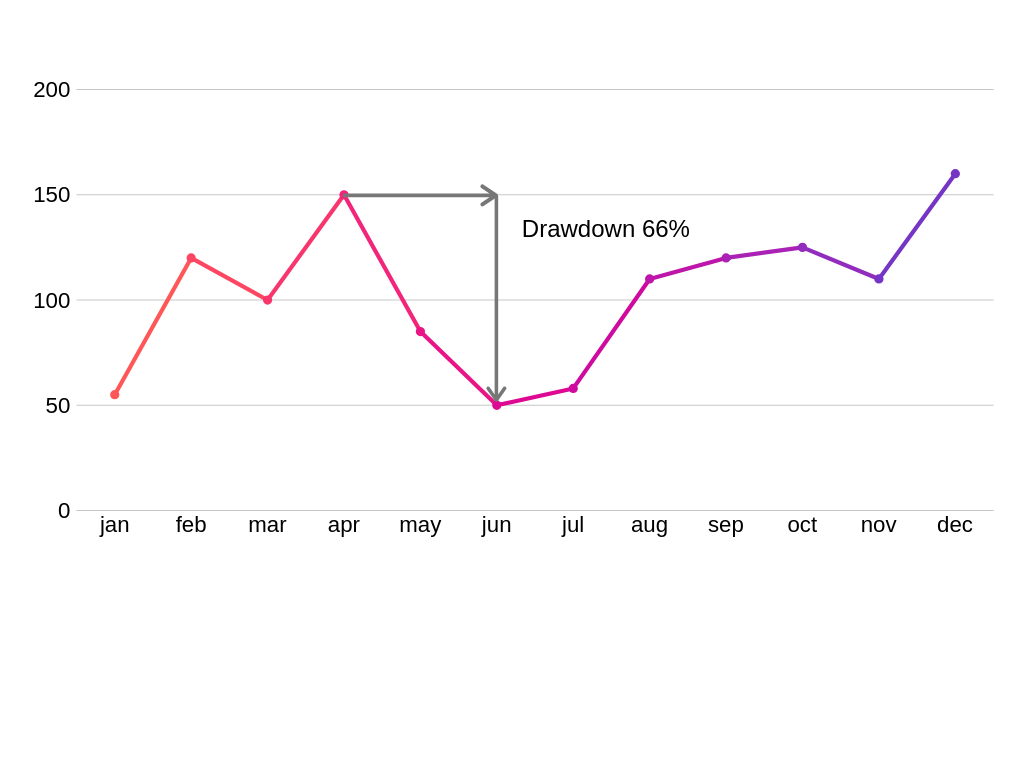
Example of drawdown. I have used months but any scale can be used.
We can still get more juice out of this parameter that even being simple does not cease to be extremely important (more than the benefits!) What if we could relate to the benefit and see how much benefit we get per unit of risk. If we could measure the risk. What if we take this drawdown as the risk? Well that is what is known as the Calmar ratio.
What does this Calmar ratio allow?
This effectively allows us to estimate what the profitability was with respect to the risk. Or rather an estimate of the risk. Let’s see if I risk a lot and earn little in a market that trading system simply does not work. Let’s take an extreme example, to risk 1000 dollars to win one. No, that does not work. Now if I risk a little and I earn a lot, that is much more interesting. Bearing in mind that there is always the possibility of losing.
How is the Calmar ratio calculated?
As a risk measure, the Calmar ratio uses the maximum historical Drawdown of the last 36 months and the yield in this period is divided by this Drawdown. Simple math.
$$ Sharpe = \frac{performance in 36 months}{Drawdown in 36 months} $$
Of course we could choose an arbitrary period of time if we do not have data of 36 months.
https://en.wikipedia.org/wiki/Calmar_ratio
But is only Drawdown risk? The Drawdown only takes the biggest loss. And the others. They do not count?
There are other ways to measure trading with respect to risk. And this is a whole field of research. A very popular one is what is known as the Sharpe ratio. This was created by William Forsyth Sharpe (Nobel of economics in 1990)
This is calculated in a similar way but uses the variability of operations as a measure of risk.
How is it calculated?
$$ Sharpe = \frac{AveRetRisk – InvWithoutRisk}{StandardDeviation} $$
Where:
- AveRetRisk is the average return with risk
- InvWithoutRisk is the investment without risk
Here’s how the standard deviation is calculated
https://en.wikipedia.org/wiki/Standard_deviation
This gives a measure of whether it is worth taking extra risk compared to an investment without risk.
This ratio has a defect and that variability is not exactly synonymous with risk. Neither distinguishes between positive or negative deviations. For example, it sometimes penalizes trading systems that have few winning operations with a lot of profit. It also has problems with correlations. I will not go into much depth with the Sharpe ratio because with this little bit we can jump to the next.
Here I leave more about this ratio for those who want to deepen:
http://web.stanford.edu/~wfsharpe/art/sr/sr.htm
https://www.investopedia.com/terms/s/sharperatio.asp
Well, we saw how the Sharpe ratio worked and that it had flaws. And … will not be there something that does not have these flaws? And if we take only the negative variability. This variant is known as the Sortino ratio.
This is in some way based on Sharpe’s and uses the standard deviation of negative yields.
It is calculated with respect to an objective or target. It can be zero or it can be some expected gain.
How it is calculated:
$$ S = \frac{R – T}{DR} $$
where:
R is the average return. The average of earnings.
T is the goal
DR is the negative variance
Here is the link with the details if you want to calculate it:
https://en.wikipedia.org/wiki/Sortino_ratio
There are many ratios and I just want to offer you an introduction. There is the K-Ratio that measures the stability of the profit curve, the Omega Ratio, the V2 Ratio, Treynor, etc. Each has their pros and cons. However, I hope you can appreciate how important this risk / benefit relationship is in trading. There are so many ways to determine it that a trader who calls himself/herself professional cannot ignore it. If he/she knew it but did not tell you, is lying ex-professed and if he/she did not know it then should better go looking for another job. In either case it is best to avoid this type of let’s call them … entertainment artists.
I still promised to tell you about a statement. And it was that a trading strategy does not particularly interest me. But I can be a hardhead, it doesn’t even matters to the big trading companies. Why? In the first place, markets are dynamic systems. What worked yesterday may well not work today. What if we had the best strategy for the right time? Or translating, measure trading well and have computing power. Let’s explain that. What if we put a cluster of computers to generate possible trading strategies and measure their performance? Let’s say billions of possible trading strategies. Obviously creating random strategies the vast majority would be pure garbage. Buuut … what about that diamond hidden among tons of garbage that the theory of the probabilities gives us? The probability is negligible, but it is not zero. This type of exhaustive search is large enough so that there are no computers on the face of the earth capable of computing it. And yes, not the Mare Nostrum, Tianhe-2A, the Summit, but all the top 500 combined with all the mobile devices and PCs on the planet. The techniques to solve this problem escape from the article but I hope now you understand why the Wall Street banks are dismissing their best traders replacing them with software engineers.
https://www.cnbc.com/2018/05/25/wall-street-banks-are-firing-traders-despite-strong-performance.html
Like for example Goldman Sachs’s that fired 600 traders to replace them with 200 software engineers:
After this article I hope to receive fewer complaints from people telling me how they have been ripped off just by giving them this powerful weapon that is knowledge. And that they tell me how much they have laughed at those who tried to cheat on them. Also that they tell me how the quality of their trading has been increased.