Enhancing Retail Trading with Advanced Software Solutions.
Whether you trade Futures, Forex, Stocks or Cryptocurrencies, you have come to the right place!
Features
Our Best Features
Our Order Flow Toolkit for NinjaTrader 8 is among the best and most complete in the world. Engineered with high attention to detail has become one of the finest ever. Carefully coded to reduce errors and therefore avoid failed operatives. Over the years has become quite robust and stable.
High resolution Trading
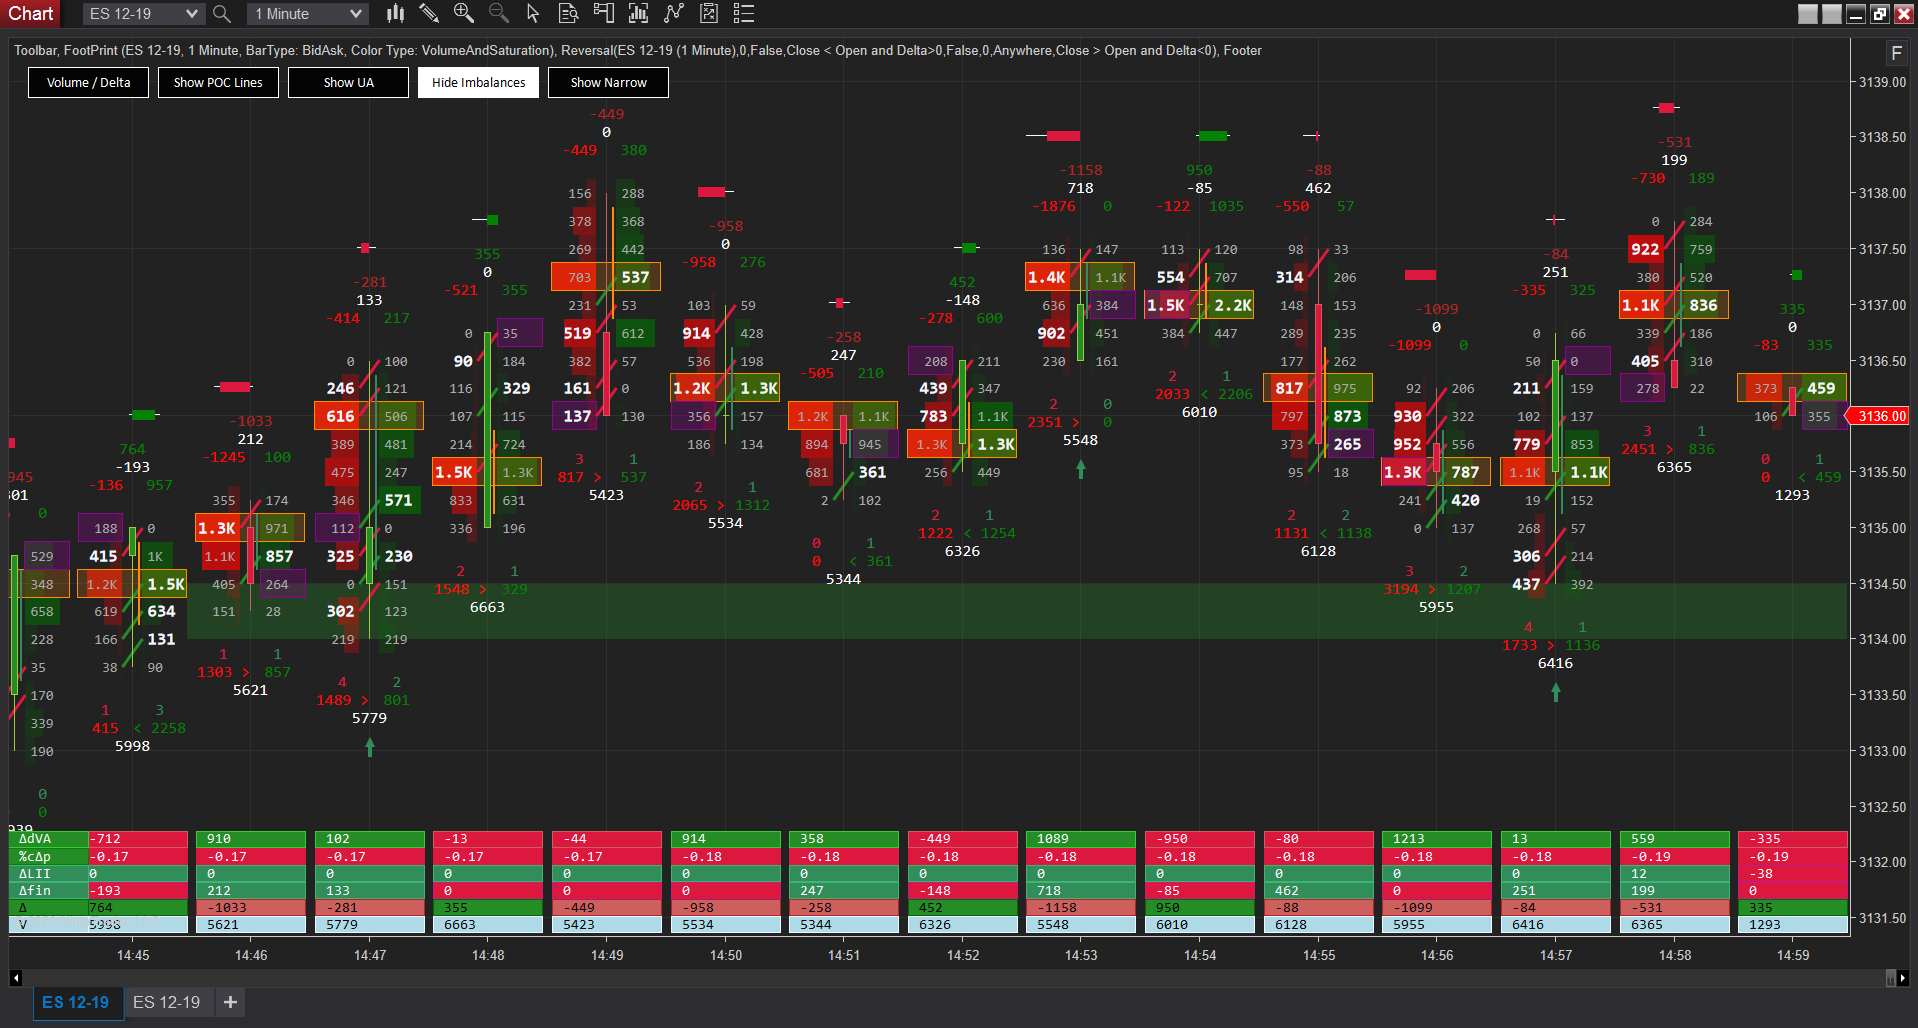
The footprint will let you see in each candle how the volume is distributed by tick.
Sophisticated Imbalance Detection
Our system adeptly identifies various imbalance patterns, including diagonal, horizontal, and combined imbalances. It quantitatively assesses these imbalances by ratio and difference, and clearly highlights imbalance zones for easier analysis.
Point Of Control
The platform efficiently pinpoints the point of control for each candle, with the capability to filter these points based on size. This feature includes an intuitive toggle, accessible via the toolbar, allowing for swift activation or deactivation to streamline chart analysis.
Unfinished auctions tracking
Our tool is equipped to filter unfinished auctions by volume and the number of elapsed candles. These auctions are automatically removed upon being reached by the price or after a predetermined number of candles. Like other features, this can be easily managed with a toolbar button for enhanced chart clarity.
Market-Leading Speed and Efficiency
Understanding the need for speed in trading operations, we've reengineered our footprint with a multithreaded engine. This allows for the processing of historical data at unparalleled speeds, leveraging as many CPU threads as available, even in high-core-count systems. Moreover, all indicators have been optimized for rapid rendering, making our platform arguably the fastest in the market.
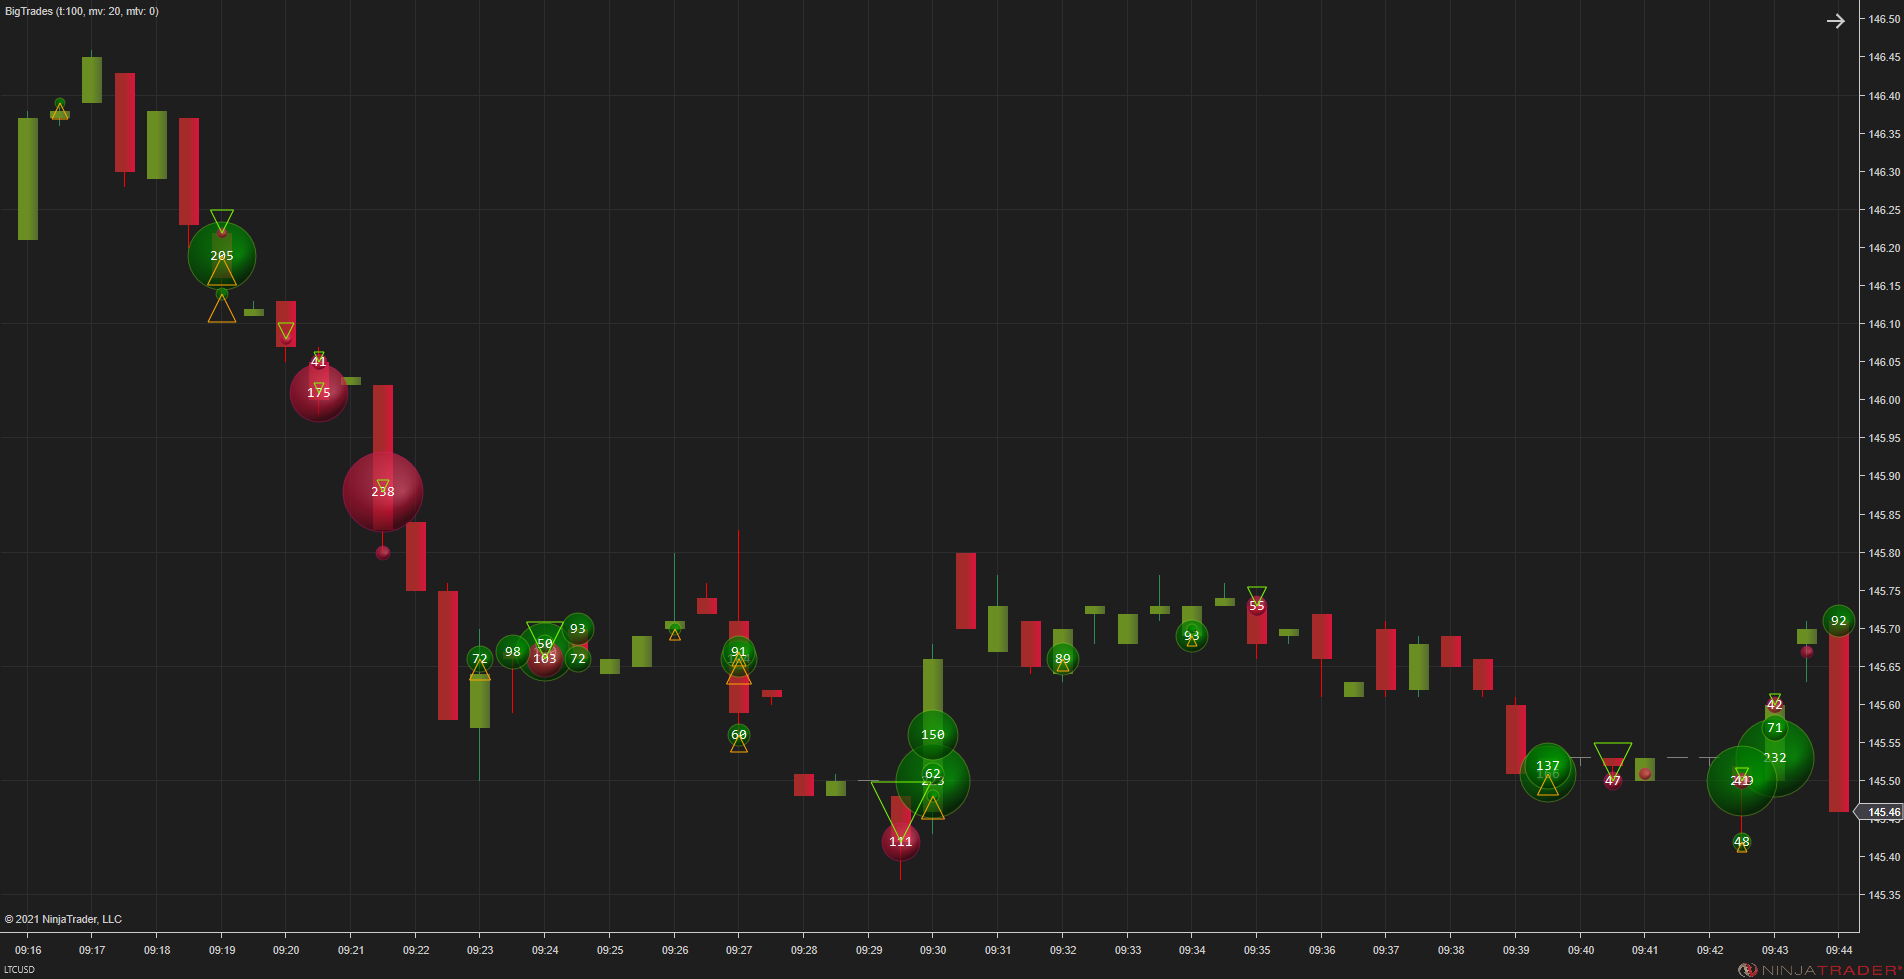
Locate where Institutional traders are operating
This tool allows you by order reconstruction to spot where traders are sliding iceberg orders and helps with location of institutional traders.
Detect when the Market is going to enter a Rally
We have found this indicator very useful to spot where a rally is about to happen or starting. This is the time of the market where you can make the largest profits.
Let it alert you when you are not looking at the screen
This indicator comes with audible alert so you don't have to be looking at the screen all the time. Only when is the right time to observe it. This will save you many of hours in front of the computer looking for the right time.
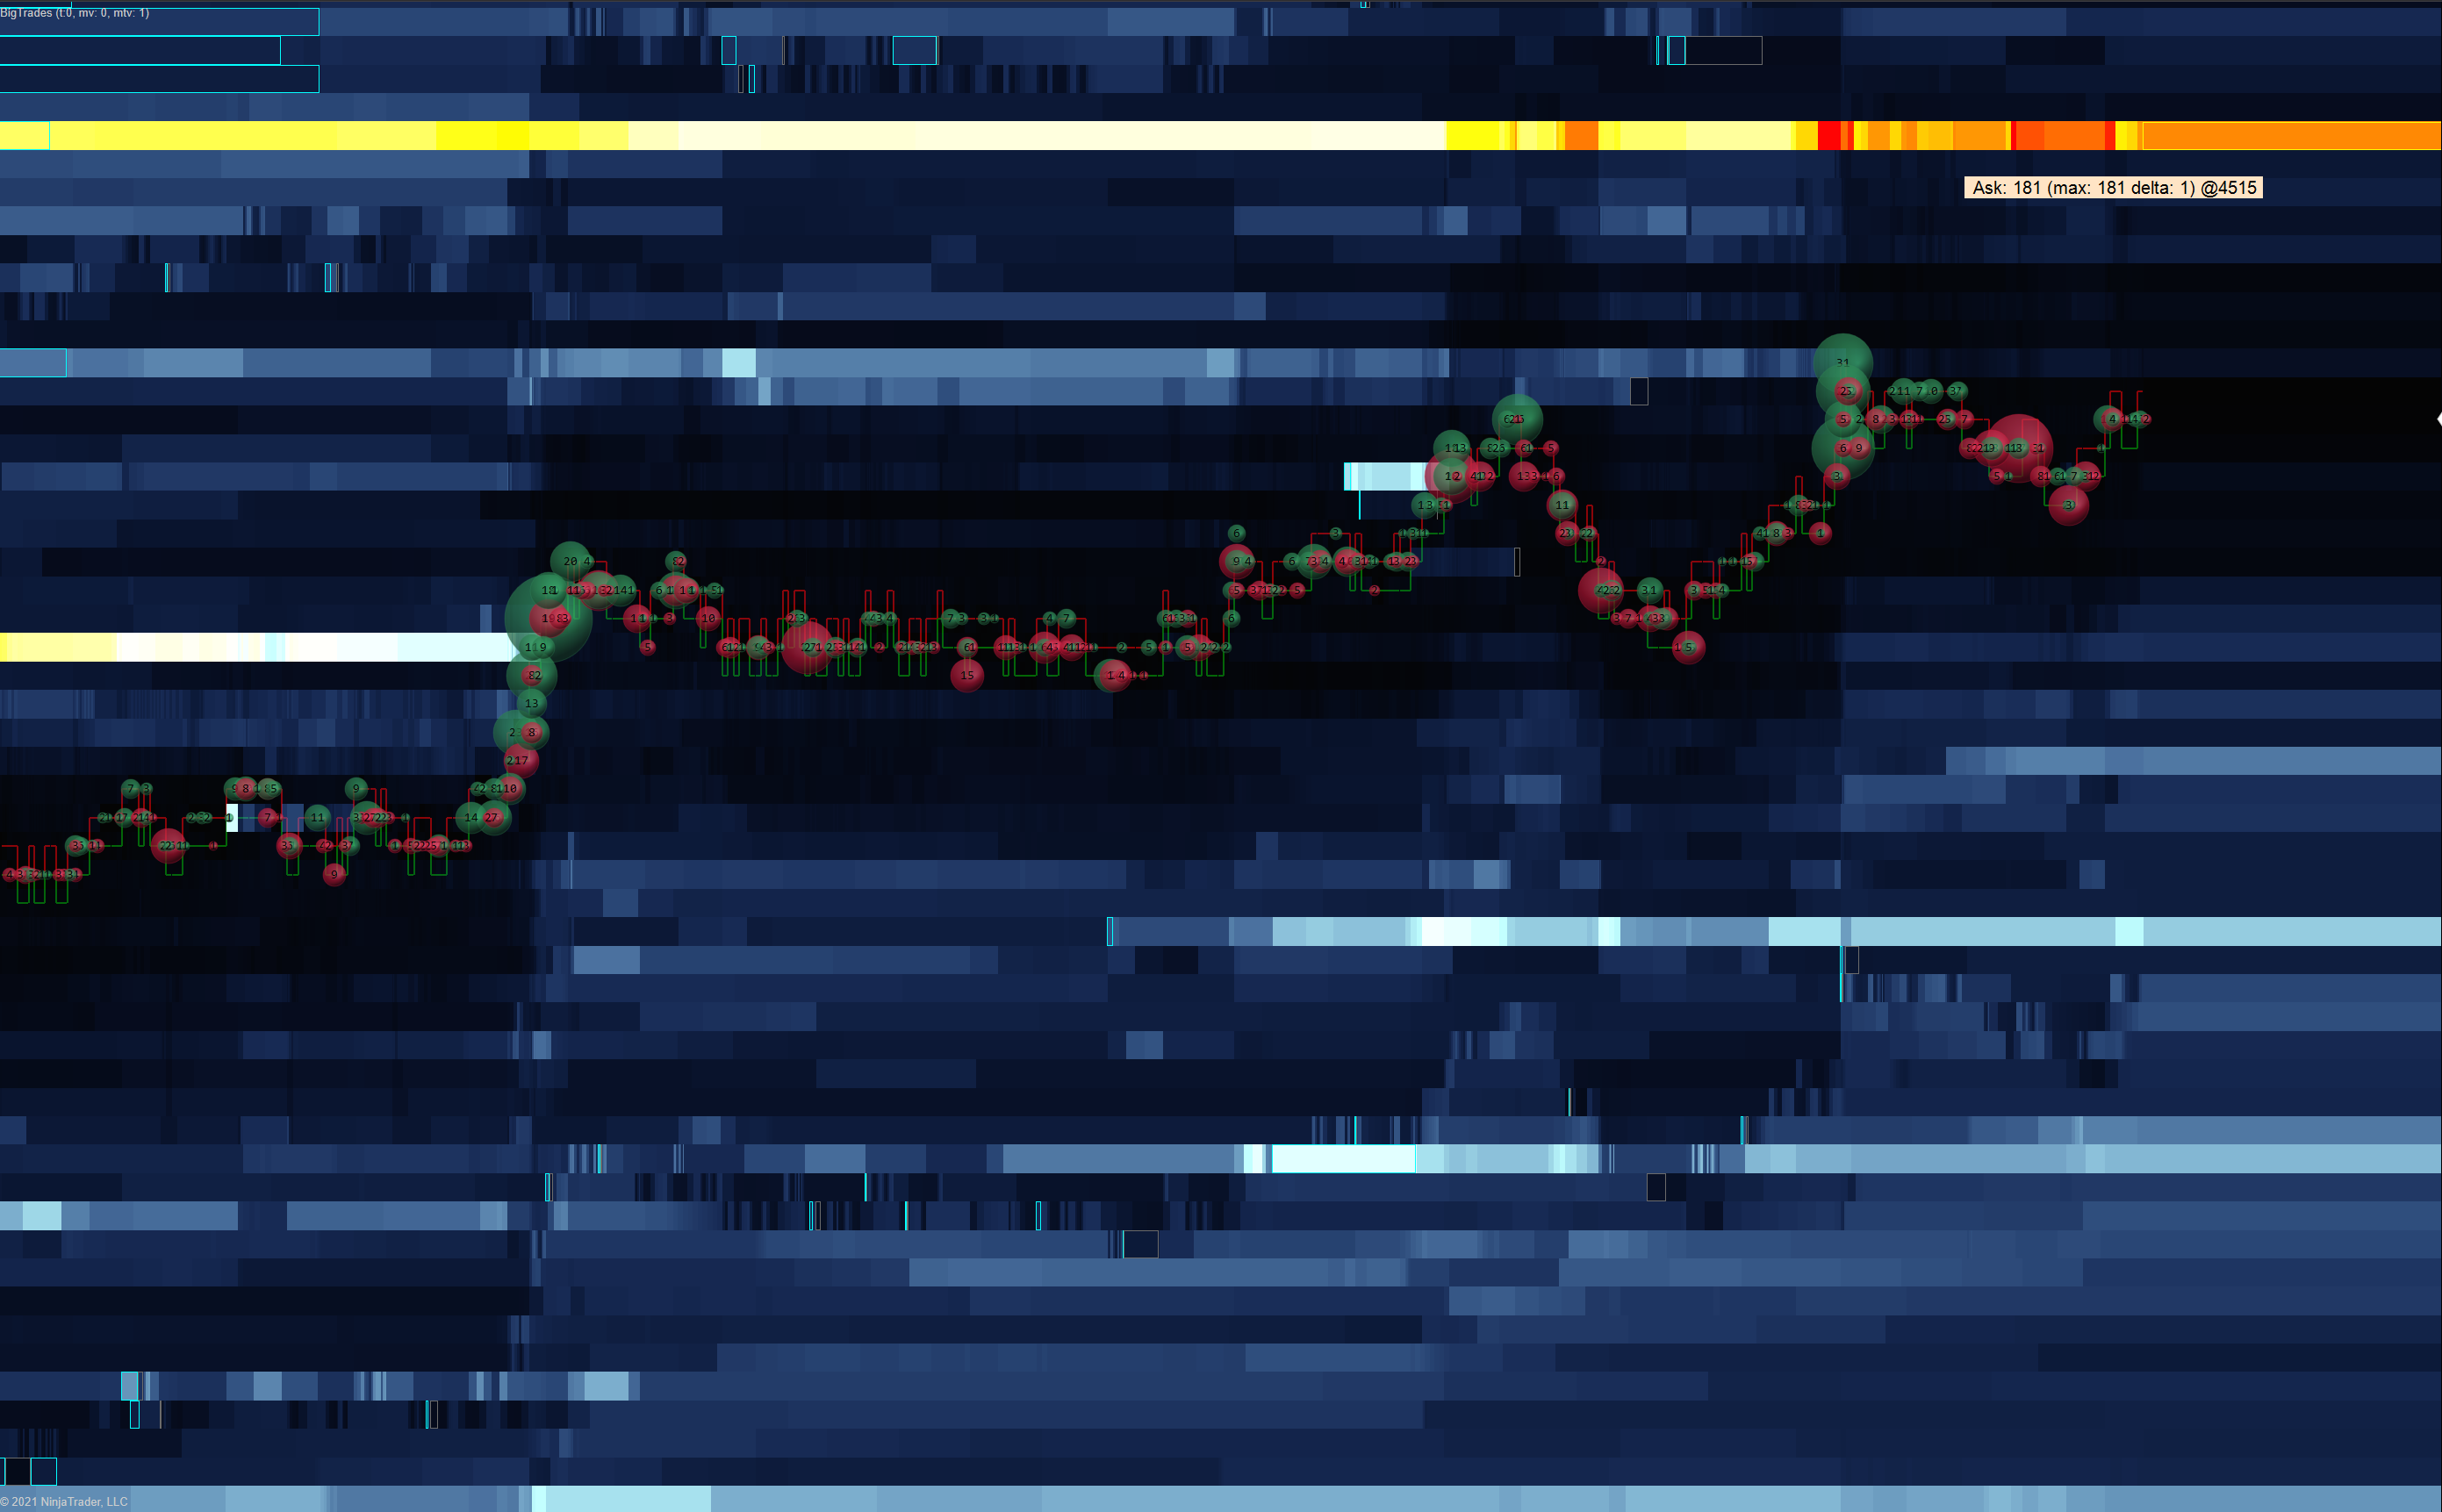
Get insight where the price is likely to bounce
The heatmap will track level II data and will put it easily to spot where a large amount of orders are standing in the way of the price. Giving you good clues on where to make the entry or exits of your operatives. We have a common and a high resolution heatmap.
Track market liquidity
This indicator has liquidity migration tracking features to inspect how level II orders are being moved. This helps tracking other traders strategies and false liquidity.
Multiple palettes to suit your visual needs
With several palettes it doesn't matters if your visual is difficult or you are adapted to some colors. It has plenty different color combinations to suit the highest need.
Very fast
The heatmap is a very resource intensive indicator due to the amount of data it displays. This is why we developed a multithreaded version that can use modern hardware.
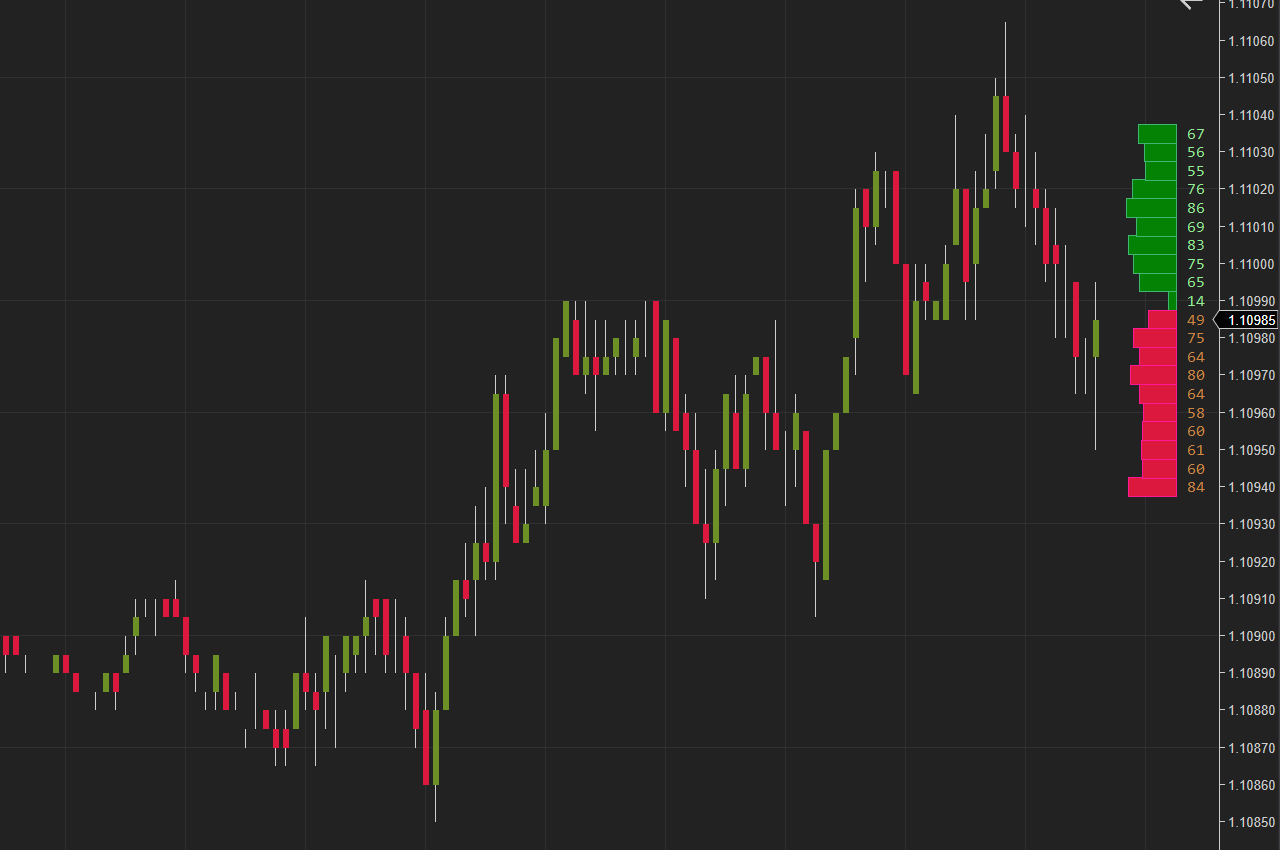
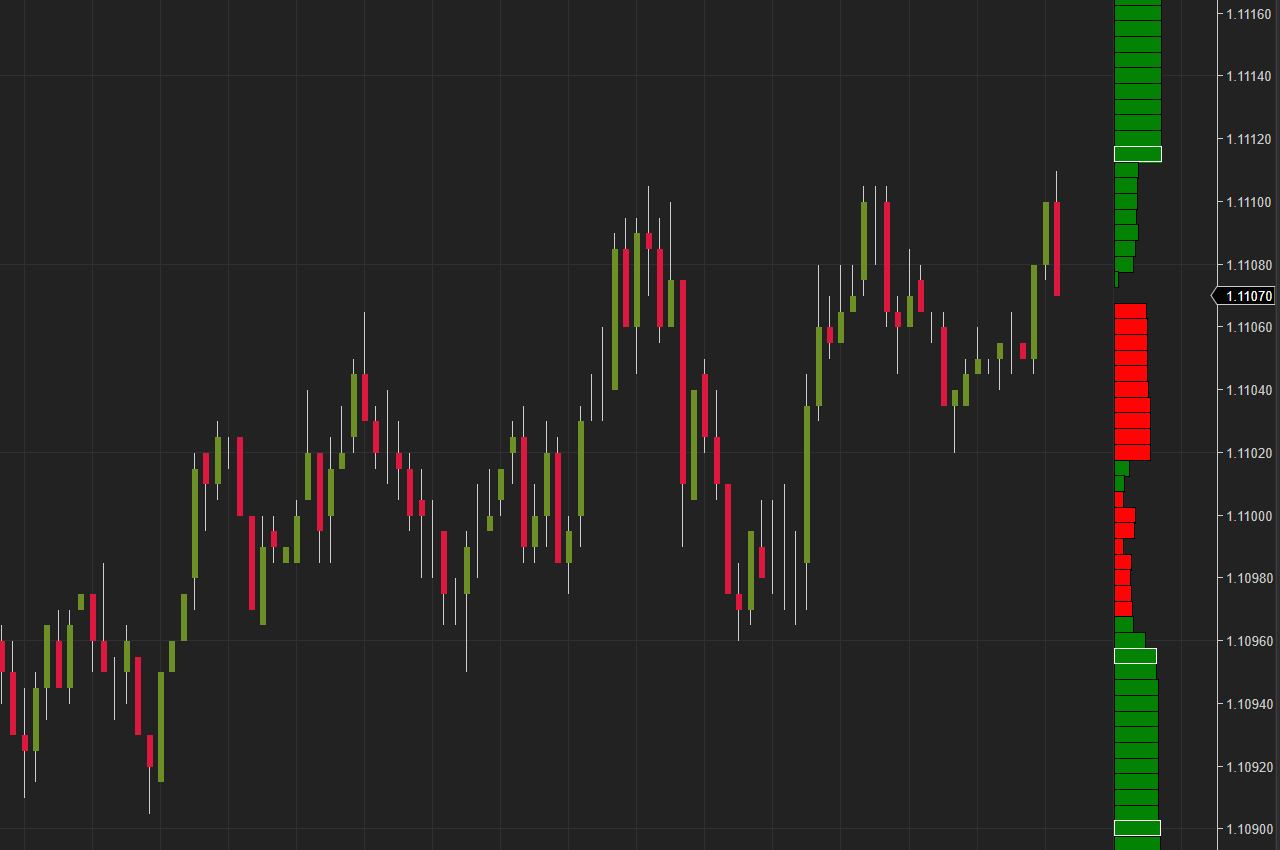
Observe Level II Data right in the chart
The order book is populated with realtime market Level II data. Allowing you to see the zones of open interest and of likely price reversals. Find support and resistance points right in the chart!
Designed to operate in the most active markets
The order book was tested and endured in the markets of highest activity where many others simply fail.

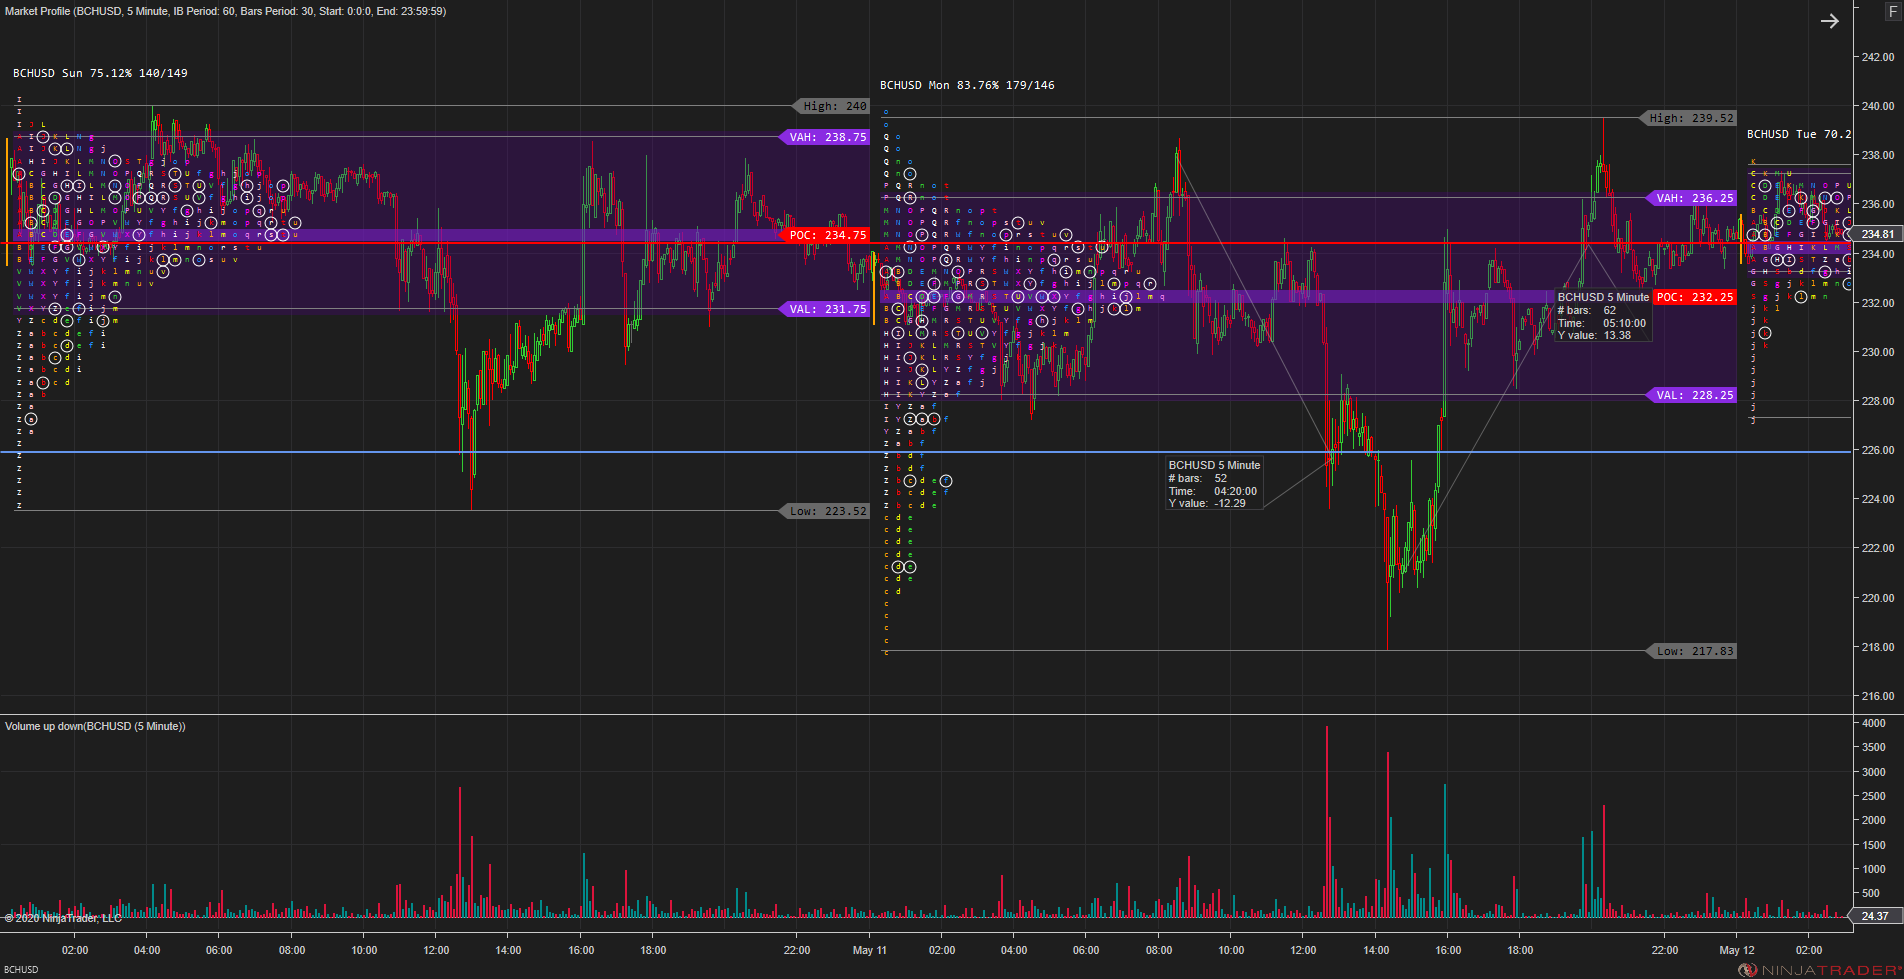
Locate important volume points
Locating points like the POC, VAL, VAH and VWAP allows you to not lose this important market information to make appropiate trading decisions.
Per session profile
With this profile you can locate the price zones, traders find more interesting during the current session.
Dynamic Profile
The Dynamic Volume Profile is just like the per session profile but instead you can dynamically select the candles you want to explore. This will let you quickly analyze a portion of the chart, to locate very interesting points.
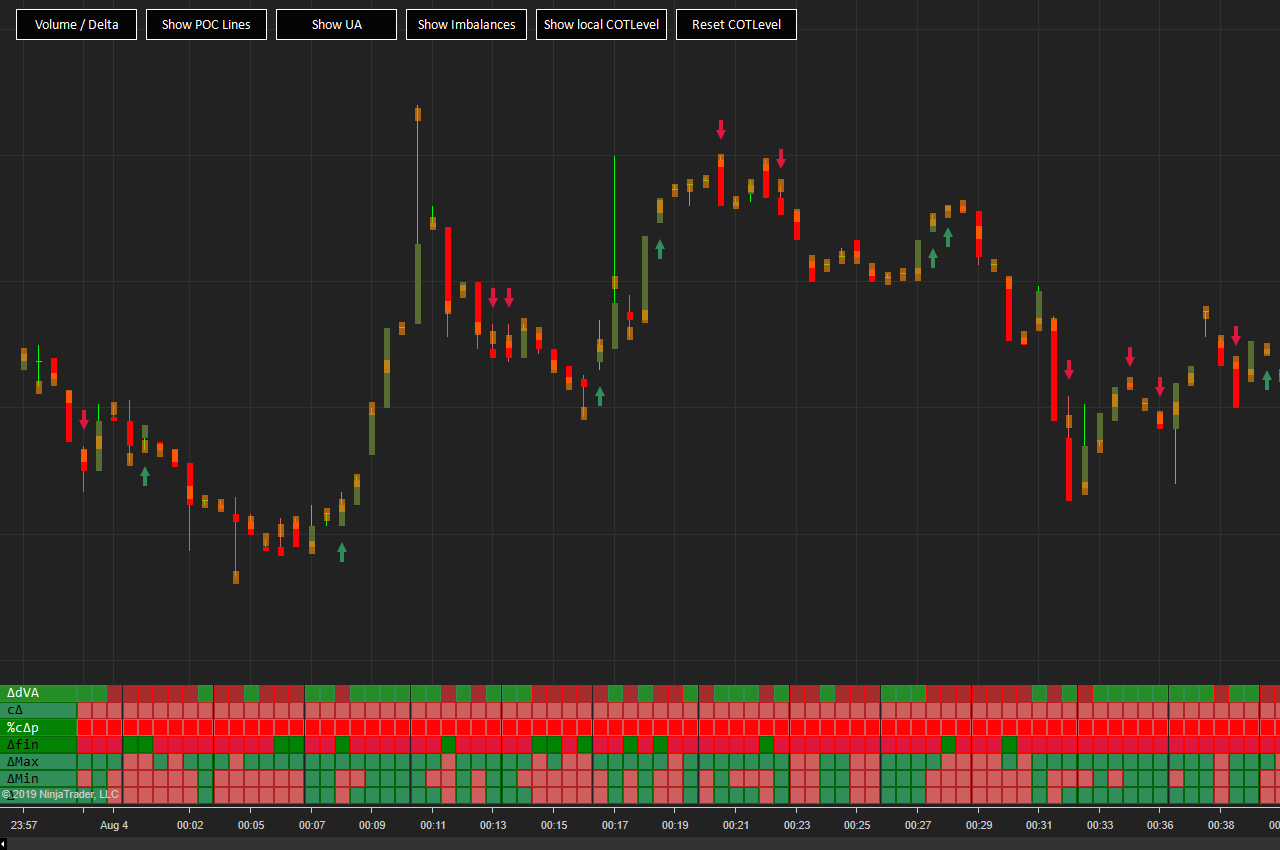
Get visual clues when the trend is going to change
This indicator will draw in the top and the bottom of the candle arrows that will indicate when the price is likely to turn. Facilitating your work tremendously. It will also signal specific candle configurations to easily spot relevant candles even if is not a reversal.
Definable Boolean equations
You can define boolean expressions based in your trading experience. A very powerful system to enhance and ease your trading. It can also alert you with a sound of your choice when the market condition appears.
Access Order Flow variables
Many Order Flow variables are exposed from the current and previous candles so you can experiment with each of them.
Detect market configurations
By many considered an evolution of the volume profile. This indicator will help you detect diferent market configurations. This will allow you to predict future market movements according to confgurations and patterns documented by experienced traders.
Different Views
This module will switch views with a hotkey in order to show you bars or profiles for easier understanding of the data. It will also let you switch on and off bar openings mark.
Associated data
This indicator shows on a per day basis important points like Value Area High and LOW, POC, High and Low. Helping you know if the active is overvalued or undervalued. Each profile displays the percentage and number of TPOS on each side of the POC.
Locate possible reversals
The COTLevel indicator will help you spot possible reversals in certain markets.
Configurable reversal position
You can adjust the COTLevel to a determined pressure difference in the bars according to the market you are operating.


Grow Your Trading
Make Your Trading More
efficient With Us
Our toolkit contains indicators with signals used by professional traders to explore markets at high resolution. Advanced Footprint, Institutional Volume Tracker, Heatmap and COTLevel will give you a deep view of the market to help you predict price movement.
- Based in Order Flow, the choice of profesional traders.
- Scalpers, Daytraders, Swing Traders and even Long term traders can benefit from it.
- Made to be confortable and configurable to your needs. Saves you precious analysis time and increases your productivity.
- Getting faster optimized with every release.
Well Documented
Comprehensive Learning Resources and Support: Our detailed manuals and instructional videos are designed to provide reliable guidance. Additionally, our active user community is always ready to offer assistance. We pride ourselves on delivering exceptional support.
Secure & Maintained
Continuously Enhanced and Up-to-Date: We prioritize swift resolution of any bugs to ensure optimal performance. Our platform is rigorously tested and has proven its reliability across a diverse, global community of traders.
Precise signals
Equipped with sophisticated signals, our toolkit enhances your trading strategy by enabling precise order placement at strategic points. This feature significantly aids in maintaining consistency in your trading endeavors.
Ready for any market
With options like volume divisor, metric suffix, updowntick, and tick grouping, permits operation in high volume and/or tiny ticks markets.

Pricing
Software Pricing
Educative
$00.00
Per Month
 Basic FootPrint
- Order Book
- Composite Volume Profile
- Footer
 ToolKit Control ToolBar
- Dynamic Volume Profile
- HeatMap
- Institutional Volume
- COTLevel
- Audible Alerts
- Reversal Indicator
- Market Profile
- TradeFlow
- SuperDom
Professional
$39.20
Per Month*
- Complete FootPrint with all signals
- Order Book
- Composite Volume Profile
- Footer with Magnifier
- ToolKit Control ToolBar
- Dynamic Range Volume Profile
- HeatMap
- Institutional Volume
- COTLevel
- Audible Alerts
- Reversal Indicator
- Market Profile
- TradeFlow
- SuperDom
* Only with two months plan
Educative
$00.00
Software Lifetime
- Basic FootPrint
- Order Book
- Composite Volume Profile
- Footer
- ToolKit Control ToolBar
- Dynamic Range Volume Profile
- HeatMap
- Institutional Volume
- COTLevel
- Audible Alerts
- Reversal Indicator
- Market Profile
- TradeFlow
- SuperDom
Professional
$590.08
Software Lifetime
- Complete FootPrint with all signals
- Order Book
- Composite Volume Profile
- Footer with Magnifier
- ToolKit Control ToolBar
- Dynamic Volume Profile
- HeatMap
- Institutional Volume
- COTLevel
- Audible Alerts
- Reversal Indicator
- Market Profile
- TradeFlow
- SuperDom
Get in touch
We Are Here For you
FAQ
Question & Answer
Some of the questions we receive from customers

Disclaimer
Futures and forex trading contains substantial risk and is not for every investor. An investor could potentially lose all or more than the initial investment. Risk capital is money that can be lost without jeopardizing ones’ financial security or life style. Only risk capital should be used for trading and only those with sufficient risk capital should consider trading. Past performance is not necessarily indicative of future results.
Hypothetical Performance Disclosure:
Hypothetical performance results have many inherent limitations, some of which are described below. No representation is being made that any account will or is likely to achieve profits or losses similar to those shown; in fact, there are frequently sharp differences between hypothetical performance results and the actual results subsequently achieved by any particular trading program. One of the limitations of hypothetical performance results is that they are generally prepared with the benefit of hindsight. In addition, hypothetical trading does not involve financial risk, and no hypothetical trading record can completely account for the impact of financial risk of actual trading. for example, the ability to withstand losses or to adhere to a particular trading program in spite of trading losses are material points which can also adversely affect actual trading results. There are numerous other factors related to the markets in general or to the implementation of any specific trading program which cannot be fully accounted for in the preparation of hypothetical performance results and all which can adversely affect trading results.